Numbers that mean something
Statistics connects your areas, says how sure it is, and warns you when something is drifting. Every tab explains its numbers with the research behind them.
Correlations with honest confidence
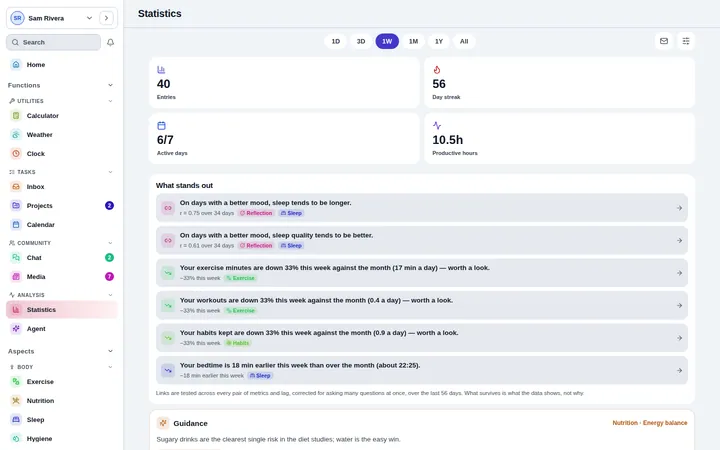
See which parts of your life move together, with the confidence of each link shown, not hidden.
Forecasts a week out
Where your trends are heading next week if nothing changes.
Drift warnings
A heads-up when something is quietly sliding away from a goal, before it costs you.
What stands out
A short list of the changes worth knowing about this week, in plain words.
Guidance under every tab
One line of evidence-backed advice aimed at your weakest number, with Why for the sources.
Guidebooks with the papers
Each area’s guidebook explains what the research says and how the tab works, with every source linked.
See your life side by side
Sleep, training, food, study, habits and mood on one board. Pick a period and Statistics shows what changed, what moves together and what is likely next.
- The period you choose, compared
- Plain-language highlights
- Confidence shown on every link
Advice that shows its sources
The line under each tab is chosen for your weakest signal, and Why opens the peer-reviewed sources behind it. If the evidence is thin, the advice is not there.
- At least five independent sources per claim
- Sources linked to the original papers
- Guidebooks with how-to steps for every tab
Questions about Insights
How much data do I need?
A couple of weeks gives Statistics enough to start, and the confidence of each finding grows with more.
Is a correlation a cause?
No, and the app never says it is. It shows what moves together and how sure it is, and leaves the why to you and the research.
Can I get a summary by email?
Yes. Email automations send a digest of your statistics on a schedule, and an alert only when something slips or goes quiet. They arrive whether or not the app is open.
Start today. It is free.
No card and no trial clock. Everything is free while the app is in early access.